Chapter 4 Light sensing and what numbers mean
Up to now, we’ve been building toward sensing things. We’ve learned a little Python, wrote some code and make some lights turn on and off. But journalism isn’t about blinking lights, it’s about learning things about your environment and reporting them to others.
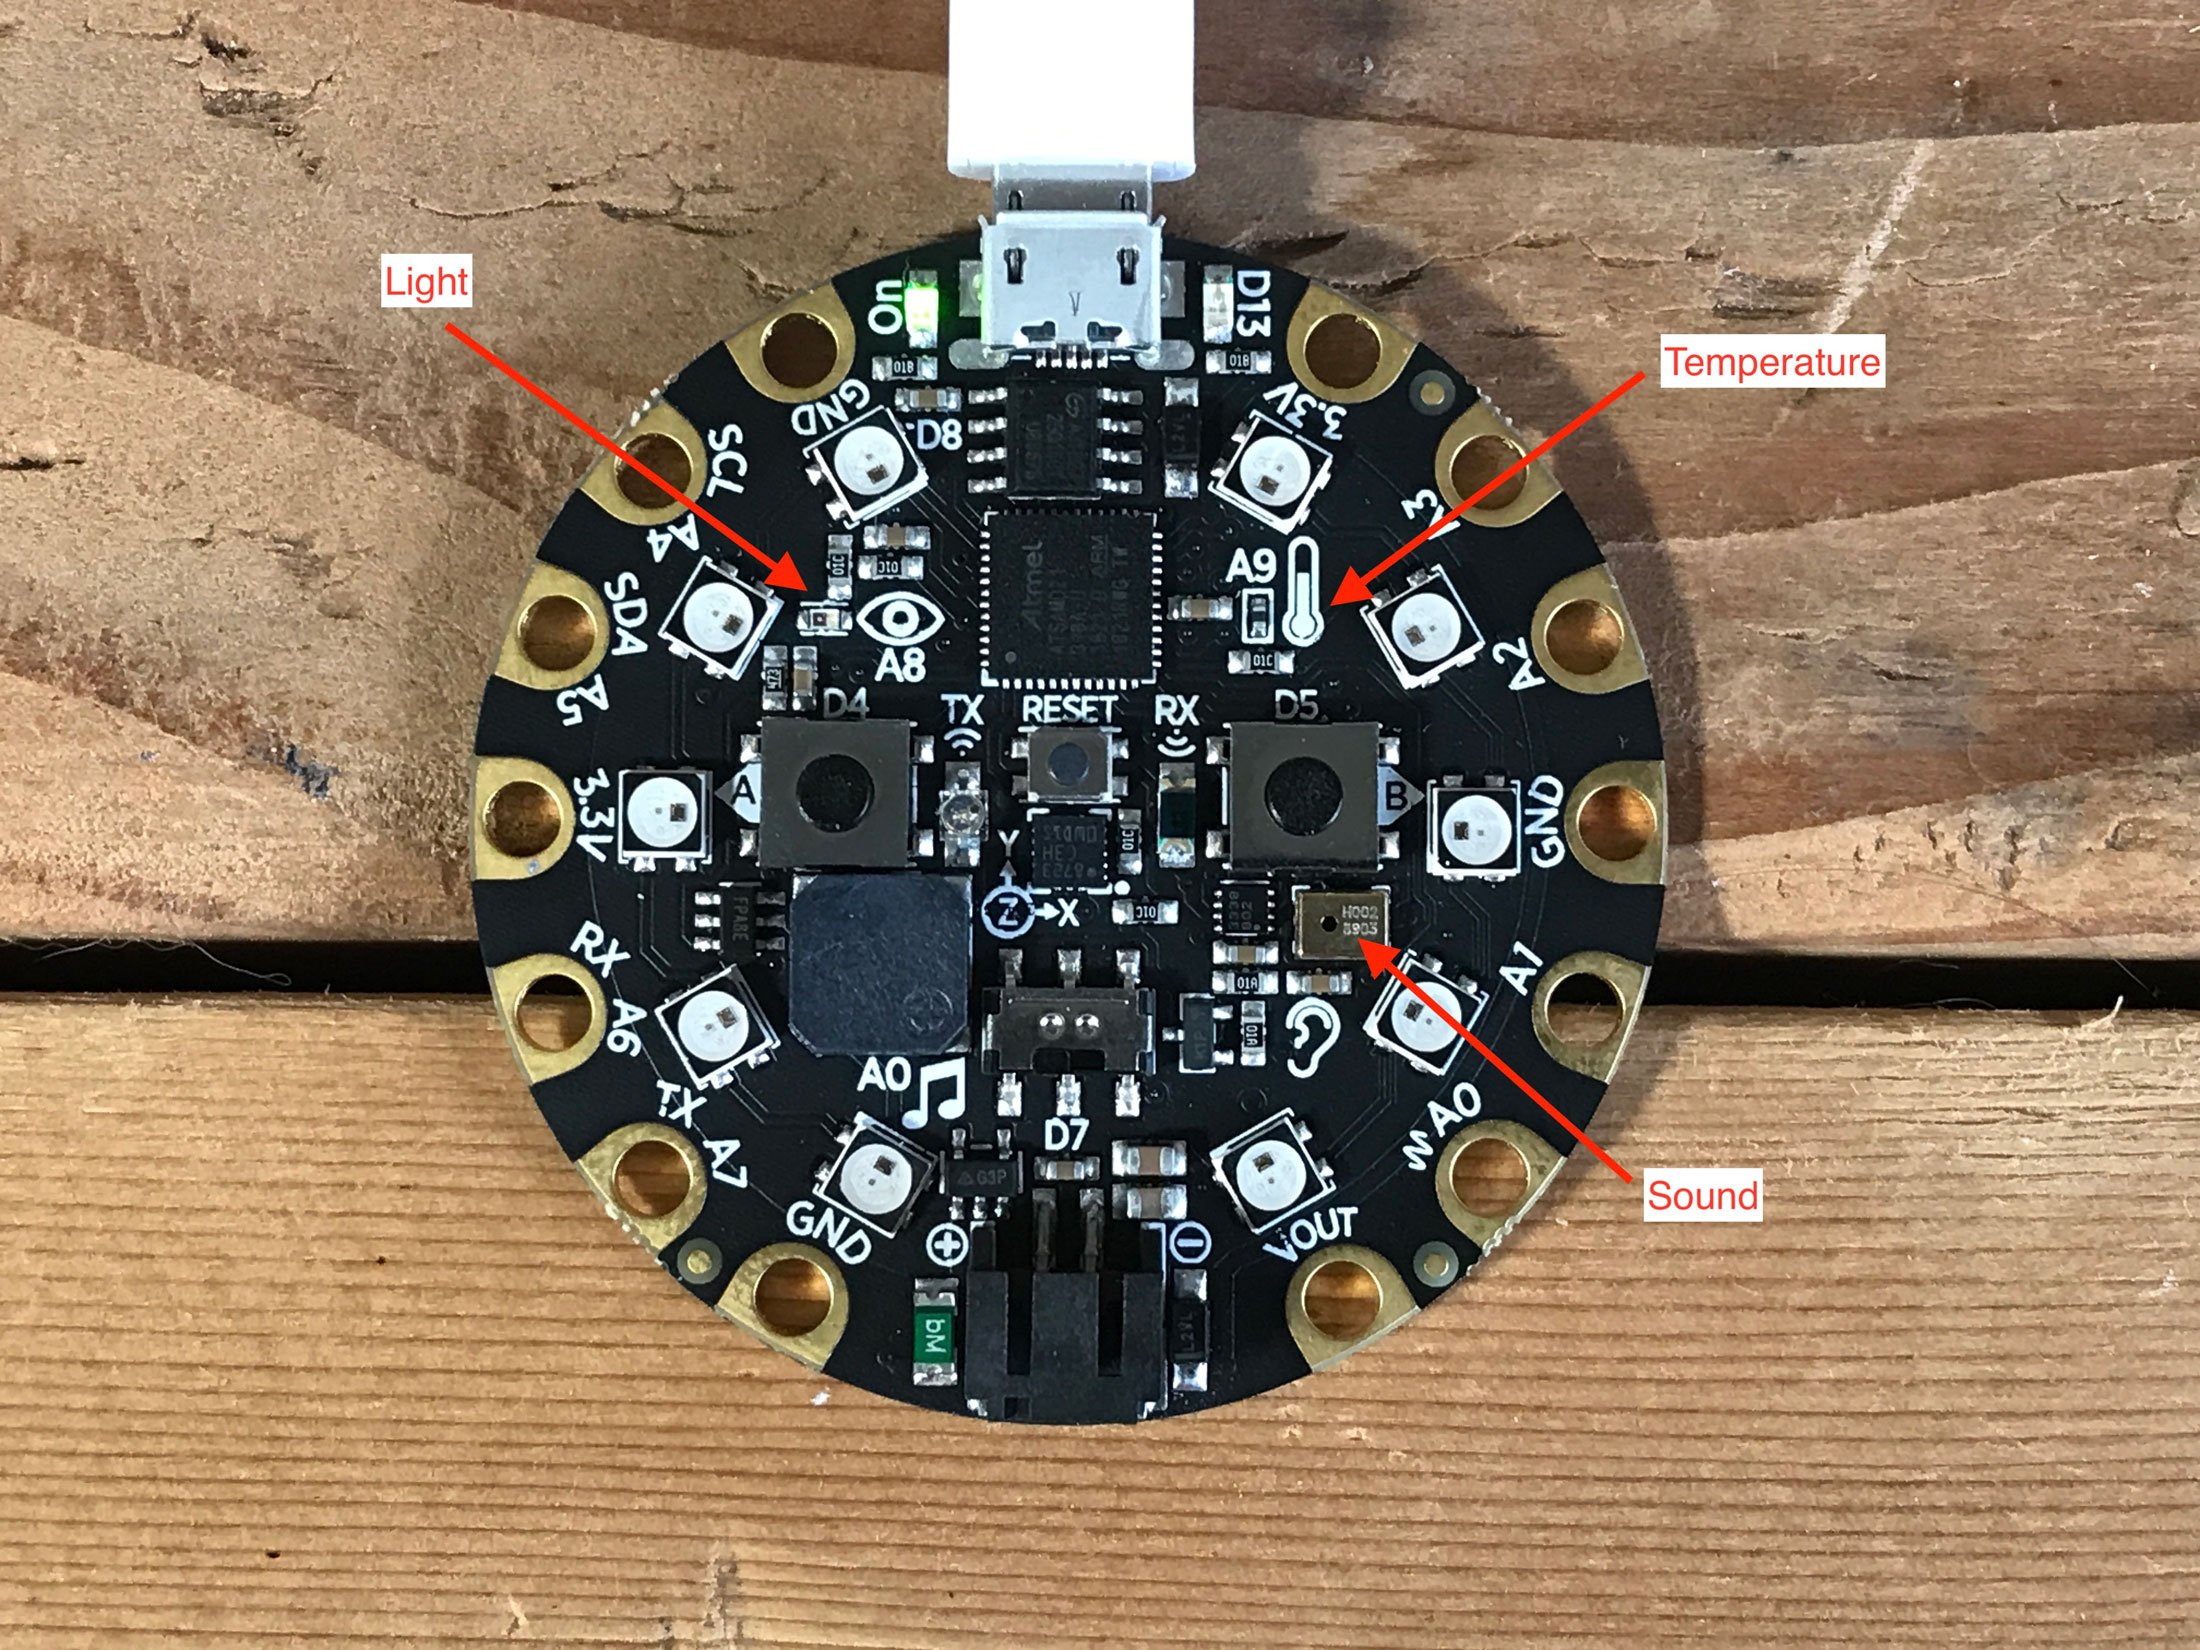
On your board are three sensors we’re going to use in the next three chapters: The light sensor, the temperature sensor and the sound sensor. If you look at your Circuit Playground, you can find them by their symbols.
 We’ll start with light. Maybe your story needs to know how bright or dark it is in a place for periods of time. The light sensor on board can tell you on a continuous scale what level of light there is. According to Adafruit’s documentation, the numbers range from from 0 – complete darkness – to 1023. Since the light sensor is an analog sensor, those are voltage measures.
Now, here’s where sensor journalism starts to get a little more difficult.
First, let’s get some code going to illustrate this.
import time
from adafruit_circuitplayground import cp

while True:
    print("Light:", cp.light)
    time.sleep(1)
Save that to your board, and then click on the Serial button in the toolbar.
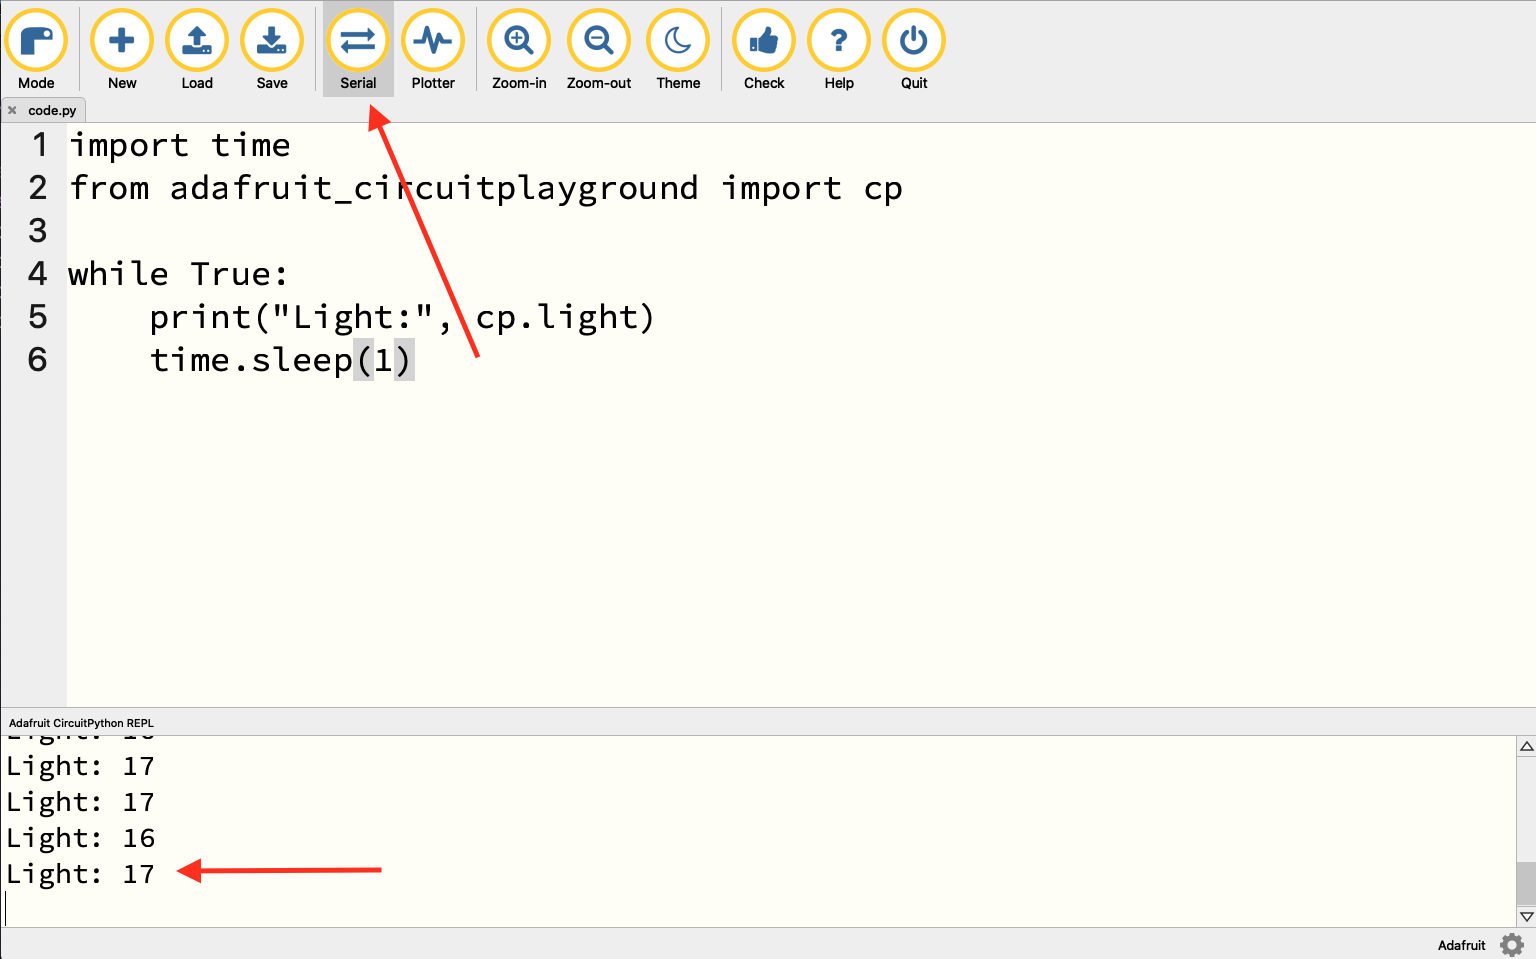
So you can see, my office is a little bit dim. I’m in a basement office with a half window next to me, but that window is partially underneath a deck, so the amount of sun coming in is indirect. So my light reading is 17. Now watch what happens when I bring in a lamp with a 100 watt equivalent LED in it.
With that very bright light – so bright you can’t look at it directly without pain – the number goes up to 320.
I walked outside on a sunny summer day without a cloud in the sky and it topped out at 321.
But what does that mean? What does 321 mean? And if direct bright light is 321, what is 1023?
Light is measured in Lux, but would you know the difference between 1500 and 10000 Lux?
As journalists, we love numbers, but sometimes the number isn’t that important. Maybe what’s better here is to know that 320 is very bright and less than 50 is dim and maybe we come up with some categories in between. Ask yourself: do you need an exact number? Is that number meaningful? Or is it enough to just know the difference between very bright, bright, dim and dark?
4.1 Not to feed your love of numbers, but …
You may have noticed, when you clicked the Serial button, that’s there’s a Plotter button.
To use the plotter, we have to have something in Python called a tuple. A tuple is a kind of data that has two parts. You create them with parenthesis, and you separate the two elements of data in the tuple with a comma. To use the plotter, you’re code has to produce a tuple. Here’s one way.
Save that to your board and click the Plotter button. You should now get a line chart showing change over time.
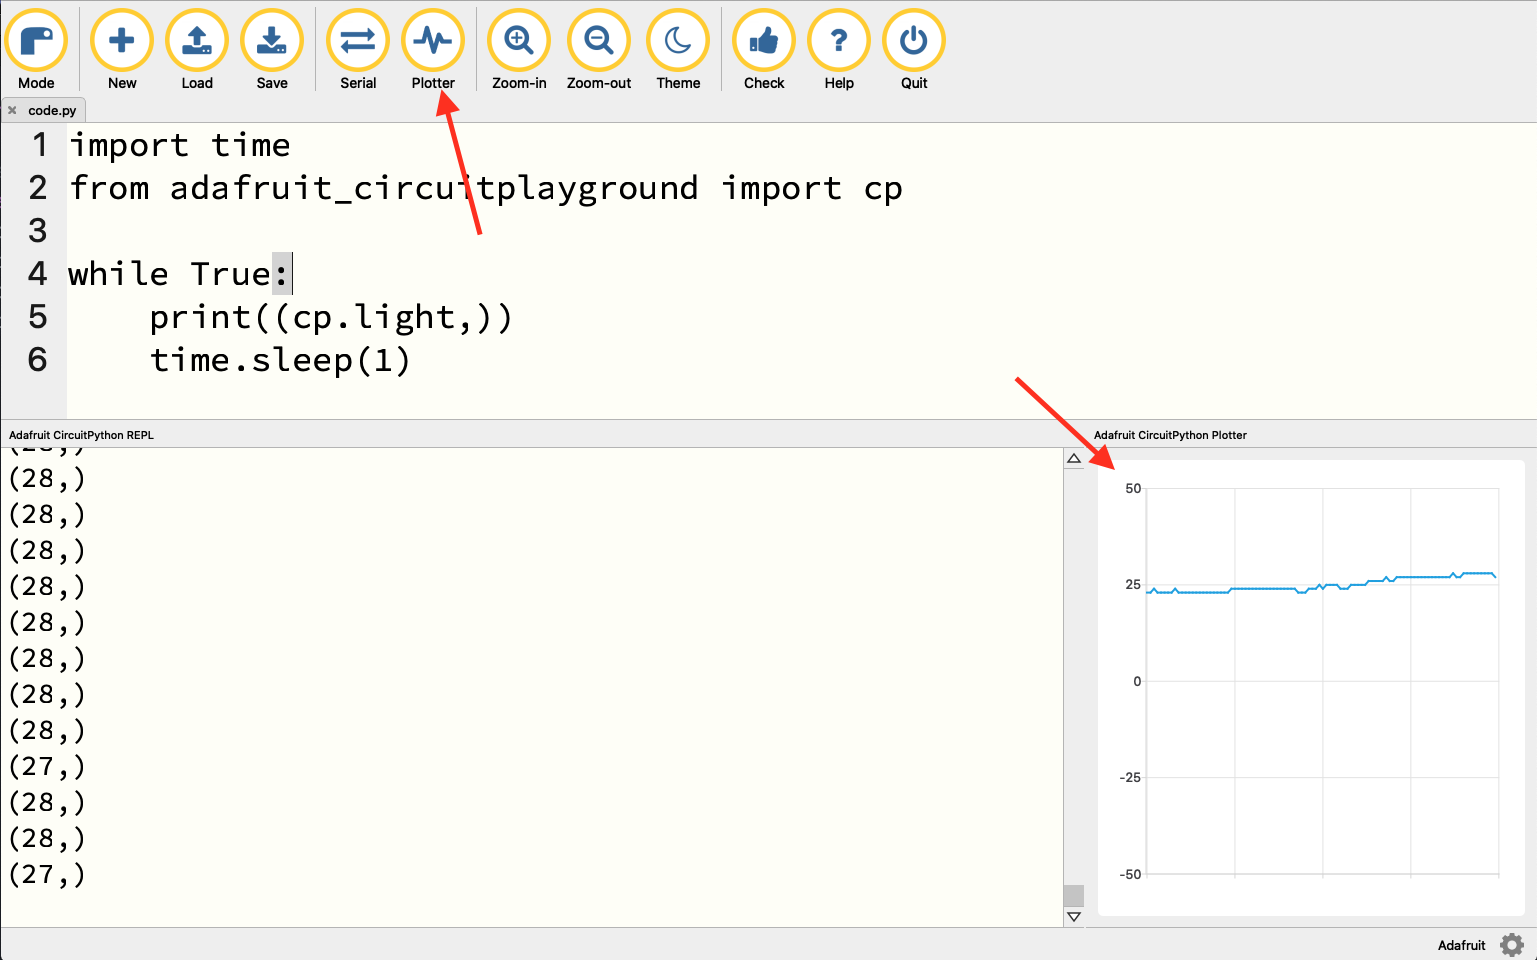
And while that’s cool to see, what does 27 mean? Something to think deeply about before you go forward with your sensor journalism project.